
Co-President's Letter | Q4 2025

Co-President's Letter
December 31, 2025 | Download PDF
In November, we hosted our 32nd Annual Baron Investment Conference. It is a unique day, mixing investment insights with more than a touch of entertainment. The entire premise of the Conference has always been to showcase the consistency of and to provide transparency into our investment process. It is meant to build trust more than revenue. These are words you don’t often hear on Wall Street.
Others look for an “edge,” something discreet, something they do not want to share. They look for an opportunity to exploit. They want to make money NOW, as much as possible and as quickly as possible, and then TRY something else. We are different. We do not (as Gen Z would call it) “gatekeep” our edge.
Our investment philosophy is simple, understandable, repeatable. But most do not have the foresight or the patience to implement it. Our edge is “time,” and that will remain constant.
But we do recognize the industry is continuously evolving, and we are excited to expand along with it. It is an expansion that builds and improves Baron Capital while maintaining what makes us unique. These are improvements we believe will benefit clients both directly and indirectly.
A Strong Foundation in Mutual Funds
Over nearly 44 years, Baron Capital has become known as one of the preeminent growth equity mutual fund firms. As Kiplinger’s stated in an article: “Baron Funds: The Masters of Growth Investing.”
The mutual fund is a fabulous structure offering many benefits. It transacts at net asset value, provides seamless access to less liquid securities, and allows for dividend reinvestment programs, to name just a few. And our Baron Mutual Funds have delivered for clients. Since their respective inceptions as mutual funds, 14 funds, representing 96% of Baron Funds’ AUM, rank in the top quartile of their respective Morningstar categories. In addition, 15 funds have delivered more than 1% of annualized alpha, including 6 funds with annualized alpha greater than 3%. Given our long-term success and the democratization of investing for more than four decades, which we helped advance, it is no wonder some refer to Baron Capital as a “mutual fund company.”
But we are a lot more than a single structure. If we can deliver an investment strategy in a manner that is more suitable for a client, we will do it. Our goal is to meet clients' needs. That is how we “Change Lives,” the mission of our business.
Launching Active ETFs the Right Way
At the 2024 Conference, I was asked if Baron Capital would offer an active ETF. My answer back then was, “We are studying it.” And over the subsequent year, we did exactly that. We repeatedly met with legal and operational experts, spoke with clients and prospects, and exchanged ideas with respected competitors. We understood the structure’s attributes, but we wanted to confirm we could achieve our investment goals without unintended consequences. It took time.
We never rush important decisions that impact clients. For us, it is never a race to see who can be first. Rather, it is a challenge to see who can do it right. We never experiment with client capital. Whether it is a new investment strategy or a new investment structure, we want to do it right the first time.
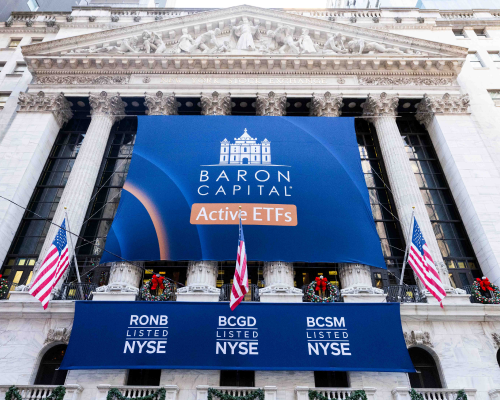
After all that studying, researching, and debating, I am thrilled that in December we launched five actively managed ETFs. They consist of three new strategies and two conversions from existing mutual funds. These are strategies that are quintessential Baron Capital.
Baron First Principles ETF® is a concentrated, all-cap growth portfolio. After attaining considerable success in the concentrated Baron Partners and Baron Focused Growth Funds, we are now bringing a similar mindset to an ETF. This ETF will invest across market caps in a balanced portfolio while investing in select, thoroughly researched businesses emphasizing their formidable competitive advantages.
Baron SMID Cap ETF® reflects the heritage of our Firm. Over half of our assets under management are in small- and mid-cap companies. We have a unique and proven ability to identify, purchase, and hold small- and mid-cap companies as they grow significantly larger over time. However, we have never offered a SMID portfolio that is able to invest across both market caps to balance exciting growth opportunities with thoughtful risk assessment.
Baron Global Durable Advantage ETF® extends our distinctive U.S. Durable Advantage strategies into global markets. Investments focus on large-cap compounders that tend to earn high returns on investment capital and generate excess free cash flow. It is an area that has recently been disregarded due to emphasis placed on the mega-cap companies.
Baron Technology ETF® and Baron Financials ETF® were converted from established Baron Mutual Funds, and target investments in sectors that we believe have long-term, enduring growth. These ETFs can complement core and other tactical positions, rounding out a client’s portfolio.
ETFs Should Be Built for Investors, Not Trends
ETFs have gained fanfare based on perceived benefits: ease of use, intraday liquidity, holdings transparency, operational savings, and tax efficiency. It is a long list. In my opinion, some of these advantages are impactful, some are more trivial, and some only apply to a few. But nothing is free. These benefits come with the cost of portfolio creation. And we will be judging our ETF success, not by assets raised in the initial months, but rather by how effectively we manage transaction costs over time.
We have made new hires, trained our professionals, and engaged third party experts to help maintain tight spreads; not only those quoted by market makers, but more importantly, the spreads investors receive when purchasing our ETFs... To me, that means going slow.
The industry has a mentality that ETFs are sold rather than bought. It is a mentality that you must get big and do it quickly. Products are designed to appeal to the masses. I disagree with this mindset.
ETFs are more than marketing campaigns, catchy slogans, and exotic features. We have an incredibly deep, talented, and growing distribution team. Katya Rosenblatt, our Global Head of Distribution and Business Development, has reorganized the group. They are eager to have thoughtful conversations about investment strategies, structure, attributes, and limitations. We want to understand clients’ unique objectives and challenges and help find the right solution and right point of access.
But there is no doubt that ETFs are hot. Firms are flooding the market with new strategies attempting to gain a piece of the growing pie. There are now more ETFs on the market than publicly traded companies. How is that even possible? And does the market really need another ETF?
I believe the answer is yes. But not just another ETF, there is a need for a different kind.
The current ETF lineup often provides access to two extremes. On one end: low-cost index hugging exposure. Low risk (as measured by dispersion from the market), but limited ability to uniquely shape investor outcomes. And on the other end: high-cost beta. Indulgent bets like triple leverage single stock securities or ultra short cryptocurrency plays. These “portfolios” provide traders with quick exposure to things they could not achieve on their own (and probably for good reason). And they charge handsomely for access to what feels like a casino.
Our approach will be different. All our investment strategies and products are designed to meet long-term goals, rather than short-term tactical impulses. This philosophy applies equally to our ETFs. These ETFs are not trading vehicles or structured products. They are foundational investment strategies and building-block tools to offset or amplify important factors. They represent investment categories that are synonymous with Baron Capital. Most firms are not taking this approach, and I am extremely confident in our potential to benefit clients in this distinct and durable manner.
Expanding Access Across Structures Without Changing Who We Are
While ETFs may get the headlines, we are also expanding in other areas.

| Growth Equity Style | Strategy | Mutual Fund | ETF | Separate Account2 | Sub-Advised | UCITS | Offshore | Model Delivery | CIT |
|---|---|---|---|---|---|---|---|---|---|
| Small Cap | Baron Discovery Strategy | ● | ● | ● | ● | ||||
| Baron Growth Strategy | ● | ● | ● | ● | |||||
| Baron Small Cap Strategy | ● | ● | ● | ● | ● | ● | |||
| Small-Mid Cap | Baron Focused Growth Strategy | ● | |||||||
| Baron SMID Cap Strategy | ● | ● | ● | ● | ● | ||||
| Mid Cap | Baron Asset Strategy | ● | ● | ● | ● | ● | |||
| Large Cap | Baron Durable Advantage Strategy | ● | ● | ● | ● | ||||
| Baron Fifth Avenue Growth Strategy | ● | ● | ● | ● | ● | ||||
| All Cap | Baron All Cap Focused Growth Strategy | ● | ● | ● | |||||
| Baron All Cap Focused Growth Plus Strategy | ● | ||||||||
| Baron First Principles Strategy | ● | ||||||||
| Baron Opportunity Strategy | ● | ● | ● | ● | ● | ||||
| Baron Partners Strategy | ● | ● | |||||||
| Non-U.S./ Global | Baron Emerging Markets Strategy | ● | ● | ● | ● | ● | |||
| Baron Global Durable Advantage Strategy | ● | ● | ● | ● | |||||
| Baron Global Opportunity Strategy | ● | ● | ● | ● | ● | ● | |||
| Baron India Strategy | ● | ● | ● | ||||||
| Baron International Growth Strategy | ● | ● | ● | ||||||
| Sector | Baron Financials Strategy1 | ● | ● | ● | |||||
| Baron Health Care Strategy | ● | ● | ● | ||||||
| Baron Real Estate Strategy | ● | ● | ● | ● | ● | ||||
| Baron Real Estate Income Strategy | ● | ● | ● | ||||||
| Baron Technology Strategy | ● | ● | ● | ||||||
| Equity Allocation | Baron WealthBuilder Fund | ● |
As of 12/31/2025
| Fund/Benchmark | Inception Date | 1 Year | 3 Years | 5 Years | 10 Years | Since Inception | Annual Expense Ratio (%) | Net Assets |
|---|---|---|---|---|---|---|---|---|
| Small Cap | ||||||||
| Baron Discovery Fund® | 9/30/2013 | 10.96 | 16.51 | 1.48 | 14.20 | 12.61 | 1.05 (6) | $1.89 billion |
| Russell 2000 Growth Index |
| 13.01 | 15.59 | 3.18 | 9.57 | 8.80 |
|
|
| Baron Growth Fund® | 12/31/1994 | (14.18) | 1.19 | (0.69) | 9.06 | 11.62 | 1.08 (6)(7) | $3.90 billion |
| Russell 2000 Growth Index |
| 13.01 | 15.59 | 3.18 | 9.57 | 8.08 |
|
|
| Baron Small Cap Fund® | 9/30/1997 | (0.66) | 12.80 | 2.77 | 11.00 | 9.89 | 1.05 (6) | $3.47 billion |
| Russell 2000 Growth Index |
| 13.01 | 15.59 | 3.18 | 9.57 | 6.67 |
|
|
| Small/Mid Cap | ||||||||
| Baron Focused Growth Fund®1 | 5/31/1996 | 22.26 | 26.59 | 11.68 | 20.97 | 14.16 | 1.05 (8) | $3.42 billion |
| Russell 2500 Growth Index |
| 10.31 | 14.32 | 2.98 | 10.55 | 8.31 |
|
|
| Mid Cap | ||||||||
| Baron Asset Fund® | 6/12/1987 | 8.20 | 12.04 | 3.56 | 11.44 | 11.27 | 1.04 (6) | $3.78 billion |
| Russell Midcap Growth Index2 |
| 8.66 | 18.64 | 6.65 | 12.49 | 10.45 |
|
|
| Large Cap | ||||||||
| Baron Durable Advantage Fund® | 12/29/2017 | 16.56 | 29.20 | 16.47 |
| 16.42 | 0.77/0.70 (6)(10) | $527.29 million |
| S&P 500 Index |
| 17.88 | 23.01 | 14.42 |
| 14.33 |
|
|
| Baron Fifth Avenue Growth Fund® | 4/30/2004 | 18.15 | 36.88 | 7.15 | 14.91 | 10.77 | 0.76/0.75 (6)(11) | $790.13 million |
| Russell 1000 Growth Index |
| 18.56 | 31.15 | 15.32 | 18.13 | 12.76 |
|
|
| All Cap | ||||||||
| Baron Opportunity Fund® | 2/29/2000 | 19.73 | 36.05 | 10.08 | 20.15 | 10.60 | 1.05 (6) | $1.80 billion |
| Russell 3000 Growth Index |
| 18.15 | 30.25 | 14.59 | 17.59 | 8.07 |
|
|
| Baron PartnersFund®3,4 | 1/31/1992 | 24.86 | 33.59 | 12.58 | 24.37 | 15.93 | 1.99 (8)(12) | $9.69 billion |
| Russell Midcap Growth Index |
| 8.66 | 18.64 | 6.65 | 12.49 | 10.22 |
|
|
| Non-U.S./Global | ||||||||
| Baron Emerging Markets Fund® | 12/31/2010 | 30.14 | 14.99 | 1.16 | 6.86 | 5.10 | 1.11 (8) | $3.54 billion |
| MSCI Emerging Markets Index |
| 33.57 | 16.40 | 4.20 | 8.42 | 3.82 |
|
|
| MSCI Emerging Markets IMI Growth Index |
| 32.03 | 16.02 | 2.36 | 8.53 | 4.58 |
|
|
| Baron Global Opportunity Fund®† | 4/30/2012 | 27.53 | 26.50 | (0.22) | 13.95 | 12.81 | 0.96/0.91 (8)(13) | $737.17 million |
| MSCI ACWI Index |
| 22.34 | 20.65 | 11.19 | 11.72 | 10.62 |
|
|
| MSCI ACWI Growth Index |
| 22.44 | 26.54 | 11.12 | 13.99 | 12.59 |
|
|
| Baron India Fund® | 7/30/2021 | (0.34) | 7.47 |
|
| (1.81) | 6.86/1.20 (8)(14) | $25.38 million |
| MSCI AC Asia ex Japan/India Linked Index |
| 2.62 | 3.24 |
|
| (3.47) |
|
|
| MSCI India Index |
| 2.62 | 11.30 |
|
| 8.15 |
|
|
| MSCI Emerging Markets Index |
| 33.57 | 16.40 |
|
| 4.71 |
|
|
| Baron International Growth Fund® | 12/31/2008 | 21.16 | 10.81 | 1.68 | 7.74 | 9.35 | 1.04/0.96 (8)(15) | $326.92 million |
| MSCI ACWI ex USA Index |
| 32.39 | 17.33 | 7.91 | 8.41 | 8.03 |
|
|
| MSCI ACWI ex USA IMI Growth Index |
| 25.74 | 14.55 | 4.03 | 7.86 | 8.32 |
|
|
| Sector | ||||||||
| Baron Financials ETF™ 19 | 12/31/2019 | 0.91 | 16.52 | 4.01 |
| 10.21 | 0.80 (9) | $56.61 million |
| MSCI USA Financials Index |
| 15.23 | 19.82 | 15.17 |
| 11.97 |
|
|
| Baron Health Care Fund® | 4/30/2018 | 10.28 | 6.03 | 2.77 |
| 10.75 | 0.87/0.85 (8)(16) | $143.99 million |
| Russell 3000 HealthCare Index |
| 14.56 | 6.84 | 6.31 |
| 9.99 |
|
|
| Baron Real Estate Fund® | 12/31/2009 | 5.19 | 13.94 | 5.65 | 10.69 | 13.13 | 1.05 (8) | $2.33 billion |
| MSCI USA IMI Extended Real Estate Index |
| 4.88 | 13.32 | 8.64 | 8.88 | 10.77 |
|
|
| Baron Real Estate Income Fund® | 12/29/2017 | 3.74 | 12.04 | 5.74 |
| 8.80 | 0.90/0.80 (8)(17) | $258.83 million |
| MSCI US REIT Index |
| 1.68 | 7.06 | 5.35 |
| 4.18 |
|
|
| Baron Technology ETF™ 19 | 12/31/2021 | 17.34 | 41.50 |
|
| 12.08 | 0.75 (9) | $149.14 million |
| MSCI ACWI Information Technology Index |
| 26.37 | 35.93 |
|
| 14.70 |
|
|
| Equity Allocation | ||||||||
| Baron WealthBuilder Fund® | 12/29/2017 | 10.20 | 18.05 | 5.29 |
| 13.18 | 1.21/1.18 (8)(18) | $559.09 million |
| S&P 500 Index |
| 17.88 | 23.01 | 14.42 |
| 14.33 |
|
|
| Broad-Based Benchmarks5 | ||||||||
| Russell 3000 Index | 17.15 | 22.25 | 13.15 | 14.29 | ||||
| S&P 500 Index | 17.88 | 23.01 | 14.42 | 14.82 | ||||
| MSCI ACWI Index | 22.34 | 20.65 | 11.19 | 11.72 | ||||
| MSCI ACWI ex USA Index | 32.39 | 17.33 | 7.91 | 8.41 | ||||
| MSCI Emerging Markets Index | 33.57 | 16.40 | 4.20 | 8.42 | ||||
1 Performance reflects the actual fees and expenses that were charged when the Fund was a partnership. The predecessor partnership charged a 15% performance fee through 2003 after reaching a certain performance benchmark. If the annual returns for the Fund did not reflect the performance fee for the years the predecessor partnership charged a performance fee, returns would be higher. The Fund's shareholders will not be charged a performance fee. The predecessor partnership's performance is only for periods before the Fund's registration statement was effective, which was June 30, 2008. During those periods, the predecessor partnership was not registered under the Investment Company Act of 1940 and was not subject to its requirements or the requirements of the Internal Revenue Code relating to registered investment companies, which, if it were, might have adversely impacted its performance.
2 The since inception date for Russell Midcap Growth Index is 6/30/1987.
3 Performance reflects the actual fees and expenses that were charged when the Fund was a partnership. The predecessor partnership charged a 20% performance after reaching a certain performance benchmark. If the annual returns for the Fund did not reflect the performance fee for the years the predecessor partnership charged a performance fee, returns would be higher. The Fund's shareholders will not be charged a performance fee. The predecessor partnership's performance is only for periods before the Fund's registration statement was effective, which was April 30, 2003. During those periods, the predecessor partnership was not registered under the Investment Company Act of 1940 and was not subject to its requirements or the requirements of the Internal Revenue Code relating to registered investment companies, which, if it were, might have adversely impacted its performance.
4 While the Fund may invest in securities of any market capitalization, 39.5% of the Fund’s long holdings were invested in SMID, Mid and Mid/Large-Cap securities (as defined by Russell, Inc.) as of 12/31/2025 (SMID represents 11.2% of the portfolio and has market capitalizations between $5.4 – $16.8 billion; Mid represents 23.0% and has market capitalizations between $16.8 – $55.7 billion; Mid /Large represents 5.2% and has market capitalizations between $55.7 – $206.2 billion).
5 The Broad-Based Benchmark for Baron Discovery Fund, Baron Growth Fund, Baron Small Cap Fund, Baron Focused Growth Fund, Baron Asset Fund, Baron Partners Fund, and Baron Health Care Fund is Russell 3000 Index. The Broad-Based Benchmark for Baron Durable Advantage Fund, Baron Fifth Avenue Growth Fund, Baron Opportunity Fund, Baron FinTech Fund, Baron Real Estate Fund, Baron Real Estate Income Fund, Baron Technology Fund, and Baron WealthBuilder Fund is S&P 500 Index. The Broad- Based Benchmark for Baron Emerging Markets Fund is MSCI Emerging Markets Index. The Broad-Based Benchmark for Baron International Growth Fund is MSCI ACWI ex USA Index. The Broad-Based Benchmark for Baron Global Opportunity Fund, Baron FinTech Fund, Baron Technology Fund, and Baron WealthBuilder Fund is MSCI ACWI Index.
6 As of 1/28/2025.
7 Comprised of operating expenses of 1.03% and interest expense of 0.05%.
8 As of 4/30/2025.
9 As of 12/5/2025.
10 Gross annual expense ratio was 0.77%, but the net annual expense ratio was 0.70% (net of Adviser’s fee waivers).
11 Gross annual expense ratio was 0.76%, but the net annual expense ratio was 0.75% (net of Adviser’s fee waivers).
12 Comprised of operating expenses of 1.05% and interest expense of 0.94%.
13 Gross annual expense ratio was 0.96%, but the net annual expense ratio was 0.91% (net of Adviser’s fee waivers, including interest expense of 0.01%).
14 Gross annual expense ratio was 6.86%, but the net annual expense ratio was 1.20% (net of Adviser’s fee waivers and expense reimbursements).
15 Gross annual expense ratio was 1.04%, but the net annual expense ratio was 0.96% (net of Adviser’s fee waivers).
16 Gross annual expense ratio was 0.87%, but the net annual expense ratio was 0.85% (net of Adviser’s fee waivers).
17 Gross annual expense ratio was 0.90%, but the net annual expense ratio was 0.80% (net of Adviser’s fee waivers).
18 Gross annual expense ratio was 1.21%, but the net annual expense ratio was 1.18% (includes acquired fund fees and expenses, net of the expense reimbursements).
19 On December 12, 2025, Baron FinTech Fund® and Baron Technology Fund® were converted from mutual funds into exchange-traded funds, Baron Financials ETF™ and Baron Technology ETF™, respectively. For additional information please refer to the prospectus. NAV and Market Price returns include returns of the Institutional Shares of the predecessor mutual fund prior to the ETF’s commencement of operations. Prior to the ETFs listing on 12/15/2025 the NAV returns of the Institutional Shares of the predecessor mutual fund are used as proxy market price returns. If the predecessor mutual fund had been structured as an ETF, its performance may have differed.
If a Fund’s historical performance was impacted by gains from IPOs there is no guarantee that these results can be repeated or that the Funds' level of participation in IPOs will be the same in the future.
† Formerly, Baron Global Advantage Fund