
Baron Fifth Avenue Growth Fund | Q2 2024

Dear Baron Fifth Avenue Growth Fund Shareholder:
Baron Fifth Avenue Growth Fund® (the Fund) gained 5.7% (Institutional Shares) during the second quarter, which compares to gains of 8.3% for the Russell 1000 Growth Index (R1KG) and 4.3% for the S&P 500 Index (SPX), the Fund’s benchmarks.
Year-to-date, the Fund is up 19.1% compared to gains of 20.7% for the R1KG and 15.3% for the SPX.
Baron Fifth Avenue Growth Fund Retail Shares1,2 | Baron Fifth Avenue Growth Fund Institutional Shares1,2,3 | Russell 1000 Growth Index1 | S&P 500 Index1 | |||||
---|---|---|---|---|---|---|---|---|
Three Months4 | 5.64% | 5.71% | 8.33% | 4.28% | ||||
Six Months4 | 18.88% | 19.05% | 20.70% | 15.29% | ||||
One Year | 34.79% | 35.14% | 33.48% | 24.56% | ||||
Three Years | (2.92)% | (2.67)% | 11.28% | 10.01% | ||||
Five Years | 10.29% | 10.57% | 19.34% | 15.05% | ||||
Ten Years | 12.24% | 12.53% | 16.33% | 12.86% | ||||
Fifteen Years | 14.07% | 14.36% | 17.29% | 14.82% | ||||
Since Inception (April 30, 2004) | 9.69% | 9.90% | 12.25% | 10.38% |
Performance listed in the table above is net of annual operating expenses. The gross annual expense ratio for the Retail and Institutional Shares as of September 30, 2023 was 1.06% and 0.78%, respectively, but the net annual expense ratio was 1.01% and 0.76% (net of the Adviser’s fee waivers, comprised of operating expenses of 1.00% and 0.75%, respectively, and interest expense of 0.01% and 0.01%, respectively), respectively. The performance data quoted represents past performance. Past performance is no guarantee of future results. The investment return and principal value of an investment will fluctuate; an investor’s shares, when redeemed, may be worth more or less than their original cost. The Adviser waives and/or reimburses certain Fund expenses pursuant to a contract expiring on August 29, 2034, unless renewed for another 11-year term and the Fund’s transfer agency expenses may be reduced by expense offsets from an unaffiliated transfer agent, without which performance would have been lower. Current performance may be lower or higher than the performance data quoted. For performance information current to the most recent month end, visit BaronCapitalGroup.com or call 1-800-99-BARON.
† The Fund’s 3- and 5-year historical performance was impacted by gains from IPOs and there is no guarantee that these results can be repeated or that the Fund’s level of participation in IPOs will be the same in the future.
(1) The Russell 1000® Growth Index measures the performance of large-sized U.S. companies that are classified as growth. The S&P 500 Index measures the performance of 500 widely held large-cap U.S. companies. All rights in the FTSE Russell Index (the “Index”) vest in the relevant LSE Group company which owns the Index. Russell® is a trade mark of the relevant LSE Group company and is used by any other LSE Group company under license. Neither LSE Group nor its licensors accept any liability for any errors or omissions in the indexes or data and no party may rely on any indexes or data contained in this communication. The Fund includes reinvestment of dividends, net of withholding taxes, while the Russell 1000® Growth Index and S&P 500 Index include reinvestment of dividends before taxes. Reinvestment of dividends positively impacts the performance results. The indexes are unmanaged. Index performance is not Fund performance. Investors cannot invest directly in an index.
(2)The performance data in the table does not reflect the deduction of taxes that a shareholder would pay on Fund distributions or redemption of Fund shares.
(3 )Performance for the Institutional Shares prior to May 29, 2009 is based on the performance of the Retail Shares, which have a distribution fee. The Institutional Shares do not have a distribution fee. If the annual returns for the Institutional Shares prior to May 29, 2009 did not reflect this fee, the returns would be higher.
(4 )Not annualized.
U.S large-cap was once again the place to be in the second quarter of 2024. The theory behind last year’s ferocious bounce back with the R1KG gaining 42.7% and the SPX rising 26.3% (the Fund gained 57.6%) was the Federal Reserve’s gearing up for significant reductions in interest rates with the consensus pricing in seven rate cuts in 2024, which would ostensibly support the economy and be bullish for growth equities. How many would have expected the R1KG to appreciate an additional 20.7% with zero rate cuts in the first six months of the year? We think there are two main reasons for markets decoupling from interest rates and continuing to power higher: 1) the economy is proving to be surprisingly resilient even at much higher rates; and 2) generative AI (GenAI).
Inflation continues to come down to normalized levels with June’s 3% CPI reading the slowest since March 2021. While the economy has slowed down, real GDP growth was 1.4% in the first quarter and the early reading for the second quarter is for stronger growth. The current dot plot and consensus expectation is for three rate cuts starting in September. Unemployment remains low at 4.1%, and a “soft landing” or maybe even “no landing” now seem to be the most likely outcome. U.S. large-cap stocks continue to outperform most other asset classes and just like in recent quarters past returns were driven by a narrow group of stocks currently referred to as the Magnificent Seven. For the June quarter, NVIDIA, Amazon, Microsoft, Apple, Alphabet, Tesla, and Meta accounted for 99.7% of the R1KG’s gain. No math skills are required to realize that the remaining members of the Index have combined to generate essentially no return at all. What do these Semiconductor, Consumer Discretionary/Retailer, Software, Hardware, Communication Services, Automobile Manufacturer and Interactive Media companies have in common? A credible GenAI story!
The largest market cap1 category within the RIKG was up 12.4% in the second quarter, while all other market cap categories in the Index declined 1.5% in the quarter. These seven stocks now represent 51.9% of the RIKG (Microsoft, Apple, and NVIDIA represent 32.9%). The Fund was on average 25.9% underweight the largest market cap category and 10.6% underweight the Magnificent Seven. Since they continued to get larger during the quarter, we ended up with an even greater, 12.8% underweight. In that context, we feel reasonably good about the Fund’s absolute and relative returns at the mid-point of the year.
From a sector attribution perspective, we did well in Consumer Discretionary and Industrials, and were helped by not having investments in Consumer Staples, Materials, Real Estate, and Energy. After adding the most relative outperformance in the first quarter, Information Technology (IT) was our weakest sector and stock selection in Financials and Communication Services also detracted from relative returns.
From a company specific standpoint, we had 17 contributors against 13 detractors in the quarter. NVIDIA, CrowdStrike, Amazon, Intuitive Surgical, Trade Desk, Alphabet, Coupang, Tesla, MercadoLibre, Microsoft, and Meta each contributed 25bps or more to absolute gains, while Shopify, Snowflake, Cloudflare, Block, Adyen, Veeva, and Endava each detracted 25bps or more. The challenging performance of the Fund’s internet and software securities within IT, as well as its Financials stocks was not limited only to the companies listed here. These sectors saw a significant multiple contraction2 during the quarter, with declines ranging from 4.4% for software to 23.0% for Financials.
We analyzed the Fund’s performance by breaking down returns into two key components: changes in valuation multiples3 and changes in company fundamentals.4 This quarter, the Fund’s weighted average multiple declined 0.8% (excluding NVIDIA, the decline was 2.8%), which means the Fund’s quarterly performance was driven in its entirety by the growth in businesses’ earnings. For the overall portfolio, during the second quarter, revenue expectations for 2024 increased by 1.3% (or by 0.3% excluding NVIDIA), operating income expectations increased by 1.4% (up 0.2% excluding NVIDIA), and operating margin rose 5bps (down 1bp excluding NVIDIA). These trends were broadly in line with what we have seen in the first quarter and were driven by a slow recovery in business fundamentals compared to low expectations. Many of our companies continue to reinvest heavily, hurting short-term profit margins but expanding long-term opportunities. While short-term focused investors penalize these stocks as can be seen by multiple contraction for the companies that have entered investment cycles (such as Shopify or Snowflake which now trade at low multiples on cyclically depressed earnings), we believe their investments make sense and as long-term investors we are willing to accept some short-term pain for the benefit of long-term gain.
Top Contributors to Performance
Quarter End Market Cap (billions) | Percent Impact | |||
---|---|---|---|---|
NVIDIA Corporation | $3,039.1 | 4.94% | ||
CrowdStrike Holdings, Inc. | 93.3 | 0.99 | ||
Amazon.com, Inc. | 2,011.1 | 0.62 | ||
Intuitive Surgical, Inc. | 157.8 | 0.60 | ||
The Trade Desk | 47.8 | 0.48 |
NVIDIA Corporation sells semiconductors, systems, and software for accelerated computing, gaming, and GenAI. NVIDIA’s stock continued its run, rising 36.3% in the second quarter and finishing the first half of 2024 up 149%. NVIDIA continued to report unprecedented growth at scale, with quarterly revenues of $26 billion growing 262% year-over-year, datacenter segment revenues of $22.6 billion up 427% year-over-year, and operating margins of 69.3%. NVIDIA’s growth is even more impressive as it is approaching a new product cycle with Blackwell going into production in the third quarter, which speaks to the urgency of demand for GPUs as customers are not waiting for the next generation architecture despite its improved performance to cost ratio. The Blackwell architecture, and in particular, the new GB200 NVL72/36 racks, which the company believes would become “the new unit of compute” (and will start shipping in 2025) would in our view: 1) increase the company’s content per server (for example an NVL72 rack would have 18 compute trays with 4 Blackwell GPUs and 2 Grace CPUs in each, and 9 networking trays with NVIDIA content); and 2) further strengthen its competitive advantages as the demand for datacenter-scale computing grows due to scaling laws (models become more capable with size and as they are trained on more data), new model types (such as Mixture of Experts that increase the demand on sharing of data between GPUs) and model optimization mechanisms (such as tensor parallelism, pipeline parallelism, and expert parallelism – which also increase the demands from the connectivity layer), and increase the relative importance of NVIDIA’s networking and full-system capabilities and in particular the capabilities enabled by the latest generation of NVLink – connecting up to 576 GPUs together, up from 8.
While the stock’s strong performance has pulled forward some of the longer-term upside (which we manage through position sizing), we remain early in the accelerated computing platform shift and in the adoption of AI across industries and therefore remain shareholders. NVIDIA’s CEO, Jensen Huang described the opportunity in his June COMPUTEX keynote:
“In the late 1890s, Nikola Tesla invented an AC generator. We invented an AI generator. The AC generator generated electrons. NVIDIA’s AI generator generates tokens. Both of these things have large market opportunities. It’s completely fungible in almost every industry, and that’s why it’s a new industrial revolution.
“We have now a new factory producing a new commodity for every industry that is of extraordinary value. And the methodology for doing this is quite scalable, and the methodology of doing this is quite repeatable. Notice how quickly so many different AI models, generative AI models are being invented literally daily. Every single industry is now piling on.
“For the very first time, the IT industry, which is $3 trillion, $3 trillion IT industry is about to create something that can directly serve $100 trillion of industry. No longer just an instrument for information storage or data processing but a factory for generating intelligence for every industry... What started with accelerated computing led to AI, led to generative AI and now an industrial revolution.”
CrowdStrike Holdings, Inc. is a cloud-architected SaaS cybersecurity vendor offering endpoint security, threat intelligence, and cyberattack response services. Shares continued their strong performance from the first quarter and were again a top contributor, rising 19.5% in the second quarter on better execution than peers in the broader security space. The company reported strong quarterly results with 33% year-over-year revenue growth, driven by customers consolidating their cybersecurity spend on CrowdStrike with free cash flow margins reaching 35%. With accelerating market share gains in its core endpoint detection and response offering, emerging products including Cloud, Identity, and SIEM reaching material scale, and newer products in data protection and AI ramping quickly, net new annual recurring revenue and total revenue look to sustain a long duration of growth. With its leading competitive positioning in cybersecurity, the growing threat landscape (which is also driven by the advancements in AI, making hackers more dangerous), its unique lightweight, single-agent, architecture, and its platform approach, we retain conviction in CrowdStrike, which is emerging as the security platform to beat in terms of scale, profitability, and free cash flow conversion.
Amazon.com, Inc. is the world’s largest retailer and cloud services provider. Shares increased 7.1% on quarterly results that exceeded consensus expectations, with revenue growth of 12.5% year-over-year and operating margins of 10.7% (up from 3.7% in the first quarter of 2023). We believe that Amazon is well positioned in the short to medium term to continue improving its core North American margins, which were 5.8% in the first quarter thanks to its continuous efficiency and cost-to-serve improvements, while AWS margins inflected higher, reaching 37.6% (or 34% excluding an accounting change in the useful life of servers). Additionally, Amazon continues to benefit from its fast-growing, margin-accretive advertising business winning market share in digital advertising thanks to its structural advantages of a closed loop system (which enables a deterministic calculation of Return on Ad Spend). We also believe that AWS is re-accelerating from a period of customer cloud optimization. Longer term, e-commerce has a long duration of growth, still accounting for less than 20% of retail. Similarly, Amazon’s cloud service, AWS remains relatively early on its s-curve with cloud representing around 13% of worldwide IT spend5, with incremental tailwinds across the three layers of the GenAI stack – infrastructure (with NVIDIA’s own AI chips – Trainium and Inferentia as well as with its offering of NVIDIA chips), platform (Bedrock) and applications (1st and 3rd party).
Top Detractors from Performance
Quarter End Market Cap (billions) | Percent Impact | |||
---|---|---|---|---|
Shopify Inc. | $85.2 | -0.83% | ||
Snowflake Inc. | 45.2 | -0.64 | ||
Cloudflare, Inc. | 28.1 | -0.64 | ||
Block, Inc. | 39.8 | -0.57 | ||
Adyen N.V. | 36.9 | -0.51 |
Shopify Inc. is a cloud-based software provider for multi-channel commerce. Shares declined 14.4% in the second quarter despite reporting solid quarterly results with revenue growth of 23% year-over-year, which implies continued market share gains, after the company announced it is entering an investment cycle. Since the increased investment period comes after over a year of consistent margin expansion, it left short-term-focused investors disappointed. We however believe that this is the right course of action for several reasons. First, the company expects solid returns on the increased marketing spend with 18-month payback periods. Second, the investment should help solidify Shopify’s competitive position and drive further market share gains. Finally, the increased spend should contribute to the probability of success in newer areas of opportunity with large addressable markets, including offline commerce, international, and enterprise. Shopify shared several metrics showing early success, with gross merchandise value up 130%, 38%, and 32% year-over-year in B2B, EMEA, and offline, respectively. We remain shareholders due to Shopify’s strong competitive positioning, innovative culture, and long runway for growth, as it still holds less than a 2% share of the global commerce market.
Snowflake Inc. is a leading cloud data platform that is predominantly used for data analytics. The stock declined 16.4% as investors evaluated the impact of a recently announced CEO transition, an investment cycle driven by spend on AI, a cybersecurity incident, and a rapidly changing competitive environment. With GenAI capturing a larger portion of the public discourse, Snowflake’s positioning in the future data stack is under scrutiny by both investors and customers. We believe Sridhar Ramaswamy, the newly appointed CEO, can help the business more efficiently transition toward an AI-first world. While Databricks and other key competitors are presenting strong results, we believe Snowflake’s brand, existing customer base, and accelerating product innovation should allow it to continue to capture share in a relatively large and strategic market. Management continues to describe strong demand trends for its core data analytics, which is also demonstrated by the relatively healthy expansion rates among existing customers while new go-to-market initiatives can help grow the customer base further. Longer term, we remain excited about the Snowflake’s strategic opportunity as the data platform for its customers.
Cloudflare, Inc. provides content delivery network services, cloud cybersecurity, denial-of-service mitigation, Domain Name Service, and ICANN-accredited domain registration services. Shares fell 14.4% during the quarter on remarks from the CEO about worsening macro conditions, citing the negative impact of geopolitical uncertainties on customer buying behavior. On the positive side, the company posted strong quarterly results with revenue growth of 30% year-over-year, showing evidence that the changes to the company’s go-to-market strategy were resonating with solid growth across its large customer cohorts (revenues from customers spending over $100,000 represented 67% of the total, up from 62% in the first quarter of 2023), double-digit improvement in sales productivity, and new pipeline attainment ahead of plan. Cloudflare reiterated revenue guidance for the year on resilience in cybersecurity spend. While we fine- tuned our model on the back of the company’s increased macro headwind commentary, pushing out revenue reacceleration estimates from the second quarter of 2024 to the first quarter of 2025, this is still ahead of guidance. We retain conviction in the long-term thesis: a strong founder-led business with a unique global network and significant pricing advantages powering a disruptive multi-product growth story with improving margins. We therefore remain shareholders.
Portfolio Structure
The Fund is constructed on a bottom-up basis with the quality of ideas and level of conviction playing the most significant role in determining the size of each investment. Sector weights tend to be an outcome of the portfolio construction process and are not meant to indicate a positive or a negative view.
As of June 30, 2024, the top 10 holdings represented 62.8% of the Fund’s net assets, and the top 20 represented 89.6%. The total number of investments in the portfolio was 31 at the end of the second quarter, up from 30 investments at the end of last quarter.
IT, Consumer Discretionary, Communication Services, Health Care, and Financials made up 98.0% of net assets. The remaining 2% was made up of SpaceX and GM Cruise, our two private investments classified as Industrials, and cash.
Quarter End Market Cap (billions) | Quarter End Investment Value (millions) | Percent of Net Assets | ||||
---|---|---|---|---|---|---|
NVIDIA Corporation | $3,039.1 | $76.2 | 12.1% | |||
Amazon.com, Inc. | 2,011.1 | 55.6 | 8.8 | |||
Meta Platforms, Inc. | 1,279.1 | 45.8 | 7.3 | |||
ServiceNow, Inc. | 161.3 | 42.8 | 6.8 | |||
CrowdStrike Holdings, Inc. | 93.3 | 33.7 | 5.3 | |||
Intuitive Surgical, Inc. | 157.8 | 33.3 | 5.3 | |||
Shopify Inc. | 85.2 | 31.1 | 4.9 | |||
Microsoft Corporation | 3,321.9 | 30.1 | 4.8 | |||
The Trade Desk | 47.8 | 24.7 | 3.9 | |||
MercadoLibre, Inc. | 83.3 | 22.7 | 3.6 |
Recent Activity
During the second quarter, we added to 9 existing positions including: Microsoft, Alphabet, Shopify, Adyen, and Illumina. We funded those purchases by reducing 3 existing positions: NVIDIA, Mastercard, and Veeva. The number of holdings in the portfolio increased from 30 at the end of the first quarter to 31 due to Illumina’s spin-off of Grail, a health care company developing a test for multi-cancer detection.
Quarter End Market Cap (billions) | Net Amount Purchased (millions) | |||
---|---|---|---|---|
Microsoft Corporation | $3,321.9 | $6.7 | ||
Alphabet Inc. | 2,258.7 | 6.7 | ||
Shopify Inc. | 85.2 | 3.9 | ||
Adyen N.V. | 36.9 | 1.9 | ||
Illumina, Inc. | 16.6 | 1.4 |
Our largest two additions in the second quarter were Microsoft Corporation and Alphabet Inc. We continued adding to our position in Microsoft. The company continues to make progress in AI, disclosing that 7% of Azure revenue growth in the quarter was driven by AI, about two-thirds of Fortune 500 companies are now using the Azure OpenAI service, that over half of Azure AI customers now also use Microsoft’s data and analytics tools, suggesting a potentially significant pull through from AI to Microsoft’s other offerings, and that GitHub co-pilot (a coding assistant) continues growing rapidly, reaching 1.8 million subscribers (up 35% sequentially). The company also continues to report strong overall financial results with revenue growth of 17% year-over-year at massive scale of $62 billion, operating income growth of 23% and EPS growth of 20%. The revenue growth was driven by Microsoft cloud which surpassed $35 billion in revenues, up 23% year-over- year, and Azure which accelerated 3% sequentially and grew 31% year-over- year in constant currency. We continue to believe that Microsoft presents an attractive combination of a limited risk of AI disruption on the one hand with a potentially material AI tailwinds on the other, through its positioning as the enterprise platform and its relationship with OpenAI.
We also added to Alphabet. The company reported solid financial results with first quarter revenue growth of 15% year-over-year, driven by 14% growth in search, 21% growth in YouTube, and 28% growth in cloud (which accelerated from 26% growth in the fourth quarter). The company has also increased its cost discipline efforts, which drove operating margins to 31.6% (compared to 25% in the first quarter of 2023). With regards to GenAI, while we are cognizant of the potential risks to the dominance of search, we believe that on the range of outcomes, Alphabet remains well positioned through its massive user distribution (9 products with over 1 billion users each), long-standing AI research labs (DeepMind and Google Brain), top AI talent, a solid cloud computing division in Google Cloud, and deep pockets for investing in AI. During the quarter, Alphabet also held its annual I/O conference, where it provided an update on its efforts in AI including: Gemini is now used by 1.5 million developers; model quality is expanding rapidly (e.g., context window is now 2 million tokens of length); the new genomics model, Alphafold 3 can predict structures of molecules and potentially accelerate drug discovery; new TPU6 AI chips has shown a 4.7 times improvement in compute performance compared to the prior generation; and Gemini for workspace is showing early data on a 30% increase in user productivity. Alphabet also has real value in assets such as Waymo, which are not factored into valuation today (and are potentially included at a negative valuation as they currently generate losses, hurting EPS). We continue to believe that the current valuation of Alphabet presents an attractive risk/reward for long-term owners of the business and have therefore increased our position.
We took advantage of share price volatility to add to our position in the commerce software platform provider Shopify Inc., the multi-channel payments solution provider Adyen N.V., and the DNA sequencing tool provider Illumina, Inc. We believe that the stock sell-offs (these holdings were down 14.4%, 29.6%, and 21.9%, respectively) were driven more by near-term investor concerns rather than fundamental issues. Valuation multiples contracted by 16%, 34%, and 24%, respectively. Shopify is investing more in the near term but we believe the investments will have high ROI (see discussion above); Adyen saw volatility with its take rate which spooked investors, but we believe that this is more due to mix rather than market share losses; and Illumina continues to operate in a more challenging part of the cycle which is impacting its near-term results, but we believe its competitive positioning remains solid and DNA sequencing will become a much larger market over time as genetic advancements continue to progress.
Quarter End Market Cap (billions) | Net Amount Sold (millions) | |||
---|---|---|---|---|
NVIDIA Corporation | $3,039.1 | $41.5 | ||
Mastercard Incorporated | 410.1 | 1.9 | ||
Veeva Systems Inc. | 29.6 | 0.7 |
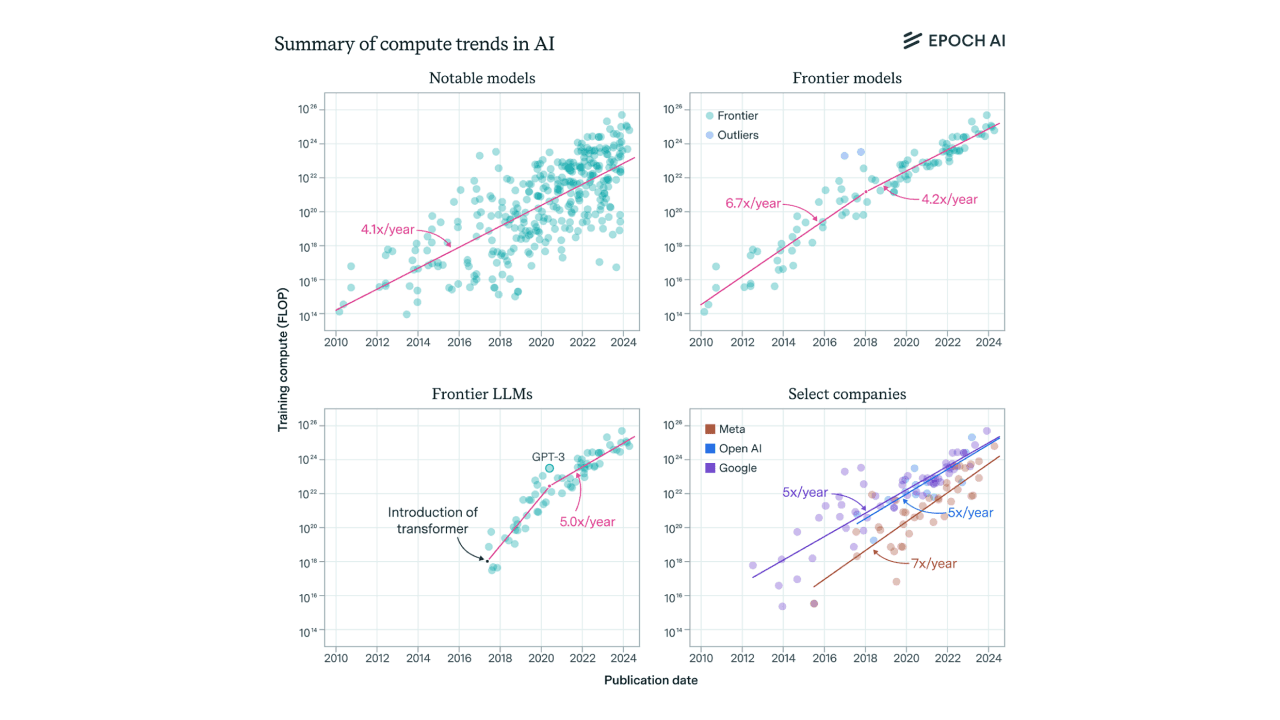
During the quarter, we reduced three existing positions. The largest was NVIDIA Corporation. We would note that our conviction level in the company has not changed although the stock’s incredible recent performance pulled forward some of its future returns, which by definition, tilts the risk/reward equation, prompting us to reduce our position. Nevertheless, NVIDIA remains our largest position in the Fund as we remain in the early innings of AI adoption across industries from health care to automotive, and as the race for Artificial General Intelligence continues. The demand growth curve for accelerated computing remains exponential as newer frontier models continue to get larger and are trained on more data – see graph below6. In addition, as we continue to go down the demand elasticity curve through innovation by NVIDIA and as AI algorithms become more compute-efficient and go up the level of intelligence generated per unit of compute curve, the demand for accelerated computing will continue to grow, benefiting NVIDIA, in our view.

We also slightly reduced our positions in Mastercard Incorporated and Veeva Systems Inc. as the companies continue progressing on their growth s-curves and as we saw a more attractive risk/reward equation elsewhere.
Outlook
As in years past, we have little to offer in the way of a market outlook. Has inflation been tamed? Will the economy continue to slow down? Will we get the three interest rate cuts or none? Trump or Biden or someone else? While these questions are not new, the answers remain elusive, and once they will get answered, other, similar questions will arise. We practice a probabilistic approach to investing and for the time being we expect to continue to operate in an environment where the range of outcomes will remain unusually wide.
Importantly, we do not structure or position the portfolio to benefit from any particular market environment. Instead, we focus on investing in what we believe are high quality business – companies with durable competitive advantages, exceptional management teams with a proven track record of operational excellence and successful capital allocation, and importantly, businesses that we believe have a long runway for growth and an opportunity to become materially larger than they are today.
These companies tend to be leaders in their industries and sell critical products and services to their customers that are hard to replace. That creates stickiness, high switching costs, and pricing power. That enables them to be resilient in the face of macro-economic challenges while continuing to invest in future growth opportunities to take market share and to emerge stronger when the environment inevitably improves.
The rapid advancement of GenAI technology presents both clear risks and compelling opportunities. While the implications of AI on the global economy and on particular industries and businesses are not yet clear, we believe our portfolio includes many companies that are well positioned to benefit from this technological paradigm shift.
Every day we live and invest in an uncertain world. Well-known conditions and widely anticipated events, such as Federal Reserve rate changes, ongoing trade disputes, government shutdowns, and the unpredictable behavior of important politicians the world over, are shrugged off by the financial markets one day and seem to drive them up or down the next. We often find it difficult to know why market participants do what they do over the short term. The constant challenges we face are real and serious, with clearly uncertain outcomes. History would suggest that most will prove passing or manageable. The business of capital allocation (or investing) is the business of taking risk, managing the uncertainty, and taking advantage of the long-term opportunities that those risks and uncertainties create.
We are optimistic about the long-term prospects of the companies in which we are invested and continue to search for new ideas and investment opportunities while remaining patient and investing only when we believe target companies are trading at attractive prices relative to their intrinsic values.
Sincerely,

Featured Fund
Learn more about Baron Fifth Avenue Growth Fund.
Baron Fifth Avenue Growth Fund
- InstitutionalBFTIX
- NAV$60.11As of 05/16/2025
- Daily change0.55%As of 05/16/2025